Motion Graphs. Minima, maxima, and critical points. Rates of change. Optimization. L'Hopital's rule. Mean value theorem.
|
Theorems (11/29)
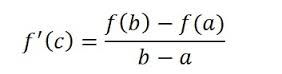
MVT: Mean Value Theorem: on a closed differentiable function, there is a point (c) at which average rate of change=instantaneous rate of change. Secant line: is the slope between two points (average rate of change) Tangent line: is the slope of one point (instantaneous rate of change) (c) is the point at which these two lines equal each other, not because they touch, but because they are parallel to each other. The universal formula is represented as such: |
Ex: Secant line parallel to Tangent line

|
|
Instantaneous
(derivative) --------> |
|
Average
<--------- |
How to Solve:
Using the given function and interval, plug in the b and a values. This will give you average slope.
Take the derivative of the given function.
Set this equal to the average slope.
Solve for c.
EVT: Extreme Value Theorem: On a closed, continuous interval, there is one absolute max and one absolute min located at either the endpoints or critical points.
If f(x) has a local mix or max at the interior point c of its domain, and if f'(x) is defined at c, then f'(c)=0
Critical Points: an interior point of the domain of f(x) where the derivative of the function=0 OR undefined
where slope changes sign
where there is a max or min
How to find Local Extrema
(How do I know if it is a max or min?)
Relevance to Calc: Find extrema using derivatives to find changes in sign of the slope
1. Identify function
2. Take derivative
3. Find critical points (set derivative=0)
4. Find sign of the derivative on each side of critical point
Pick values around the critical point
Plug these values into the derivative
Is the sign positive or negative?
Use a sign chart
- to +=local minimum
+ to -=local maximum
How to find Absolute Extrema
1. Identify function
2. Find derivative
3. Find ctiyical points
Compare y's for endpoints
asdkufjadskf
IVT: Intermediate Value Theorem:
Rolle's: If there are two y's that are the same, there is a max or a min.
Motion Graphs (11/29)
Position-time p(t)
Velocity-time v(t)
Acceleration-time a(t)
Velocity is defined as an object's change in position over time.
Thus, velocity is the slope of position aka v(t)=p'(t)
Acceleration is defined as an objects change in velocity over time.
Thus, acceleration is the slope of velocity a(t)=v'(t)=p''(t)
On a position-time graph, the object is farthest away from the starting point when the function crosses the x-axis.
When the function is positive and increasing, the object is moving quickly/at a constant rate forward.
When the function is positive and decreasing, the object is slowing down forward.
When the function hits the x-axis, the object changes direction.
When the function is negative and decreasing, the object is moving quickly/at a constant rate backward.
When the function is negative and increasing, the object is slowing down backward.
On a position-time graph, extrema denote a slope of 0. Where slope is 0, velocity is 0.
On a velocity-time graph, the extrema of the original function are represented when the velocity function crosses the x-axis.
When the velocity graph decreases from positive to negative, the graph has a maximum.
When the velocity graph increases from negative to positive, the graph has a minimum.
**On a velocity-time graph, the original function is increasing wherever v(t) is positive.
the original function is decreasing wherever v(t) is negative.
On a velocity-time graph, constant velocity is graphed as a horizontal line. Conversely, this means on a p(t) graph, slope is constantly increasing/decreasing/0, not necessarily 0.
|
First Derivative Test (11/29)
Purpose: To see where the original f(x) is increasing or decreasing. To identify local extrema How to Apply the First D/dx 1. Identify the function 2. Take the derivative Factor, if possible. 3. Set equal to zero (to find critical point) 4. Pick values around the critical point 5. Plug these values into the derivative Is the sign positive or negative? 6. Use a sign chart - to +=local minimum + to -=local maximum |
Ex Local Min
slope changes from negative to positive 
Ex Local Max
slope changes from positive to negative 
|
|
Second Derivative Test (11/29)
Purpose: To determine concavity of the original function f(x) How to Apply the Second D/dx 1. Do the First D/dx 2. Take the second derivative 3. Set the second derivative equal to zero (to identify any POSSIBLE points of inflection) 4. Pick values around the possible points of inflection. 5. Plug into the second derivative. 6. Make a sign chart to see where second derivative changes sign. If f''(x) changes sign, there is a point of inflection. If f''(x) does not change sign, there is NOT a point of inflection. 7. Use the change in sign to determine where the original function concave up or down. When f''(x) is positive, the original function is concave up When f''(x) is negative, the original function is concave down Important to Note: When f'(x)=0 AND f''(x)=0, the second derivative test fails, because an extrema cannot be a point of inflection. Thus, we must refer back to the first derivative test. |
|
|
Related Rates (2/15) How one quantity is changing in relation to another. Volume: The formula for a cone involves 2 variables. More often than not, the question will not give you enough information about the cone for you to just plug in numbers. Thus, the good lord created ratios. Since radius changes with height for a cone, R can be related to h by a proportion: r/h. Given the value of either when the cone is full, set the value (r to r, h to h) equal to r/h. You can now rewrite the proportion as a value of r or a value of h. They should be reciprocals of each other. Typically, the question will ask you to find the rate of change of r or h (dr/dt or dh/dt) at a given radius or height. If the question asks for dr/dt, rewrite the formula as r. If the question asks for dh/dt, rewrite the formula as h. Using the volume formula, replace your values to get a single variable of either r, or h. Take the derivative of that function, and plug in your given values. Solve for your unknown variable. |
Volume Formulas: (Need to know!!!) 
|
For triangles,
the question will typically involve a falling ladder, rising balloon, or kite.
These types of problems require knowledge of the pythagorean theorem.
Here are a few good examples:
http://www.math-prof.com/Calculus_1/Calc_Ch_21.asp
the question will typically involve a falling ladder, rising balloon, or kite.
These types of problems require knowledge of the pythagorean theorem.
Here are a few good examples:
http://www.math-prof.com/Calculus_1/Calc_Ch_21.asp
